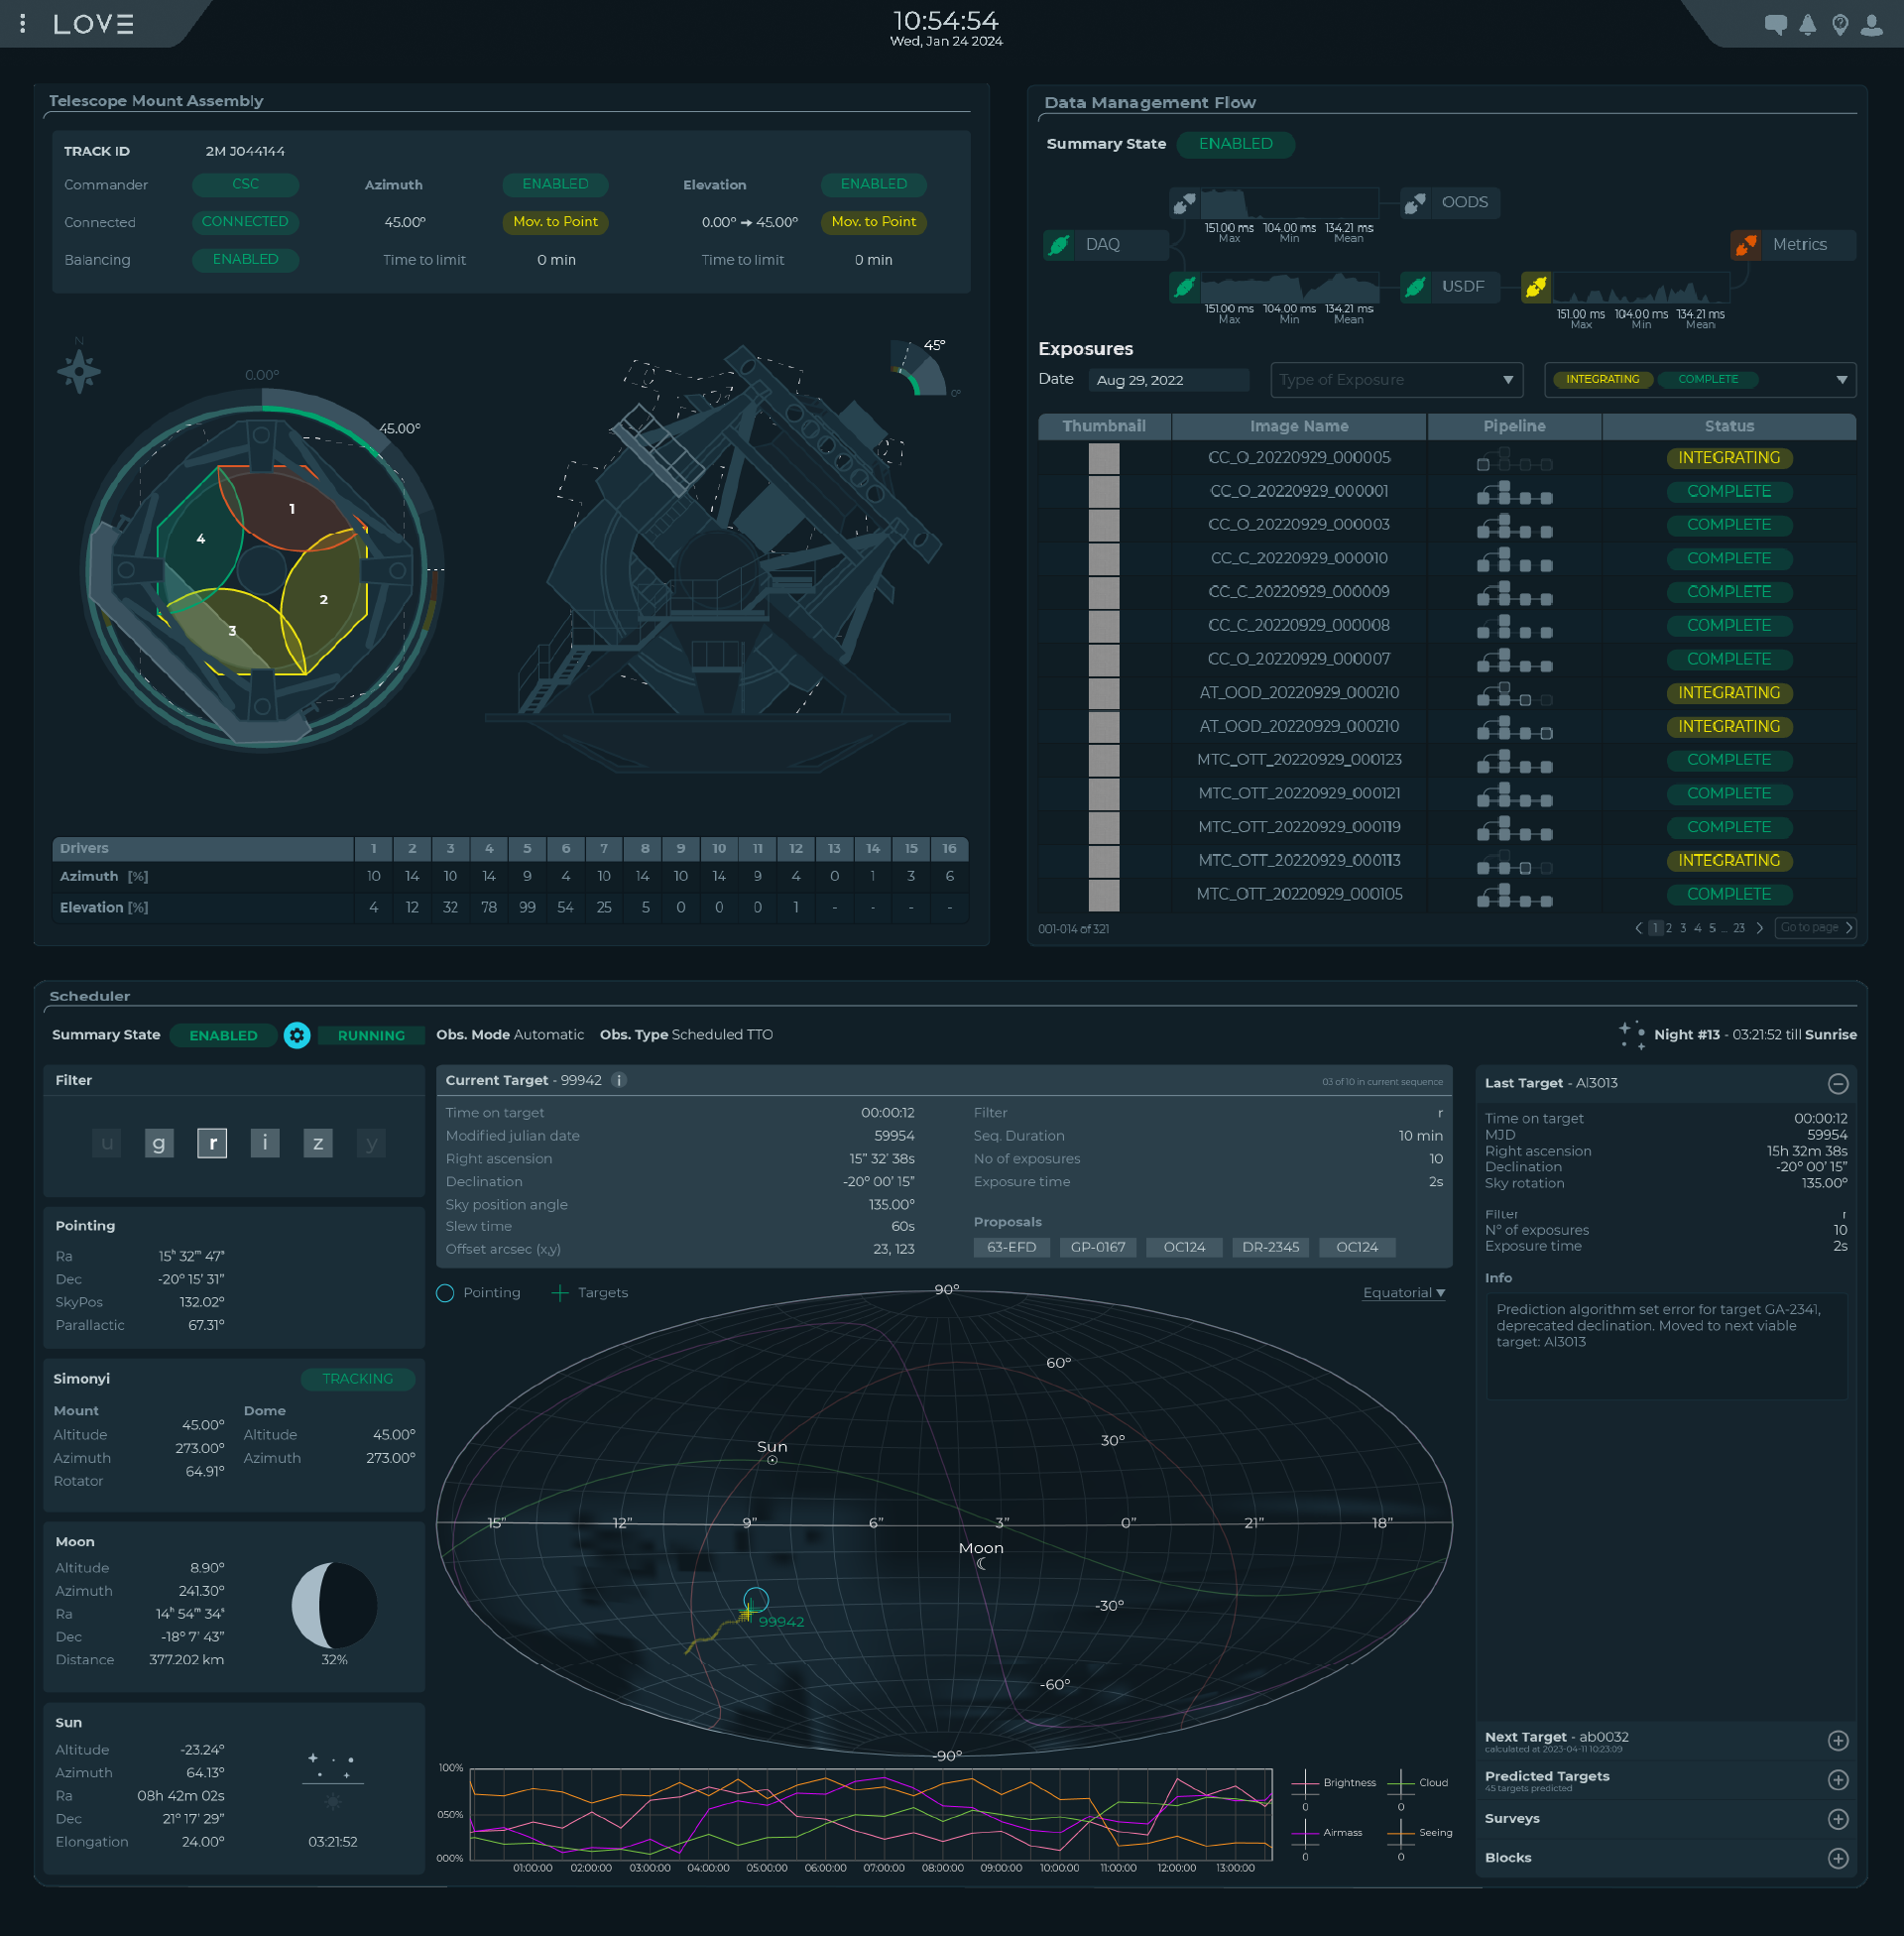
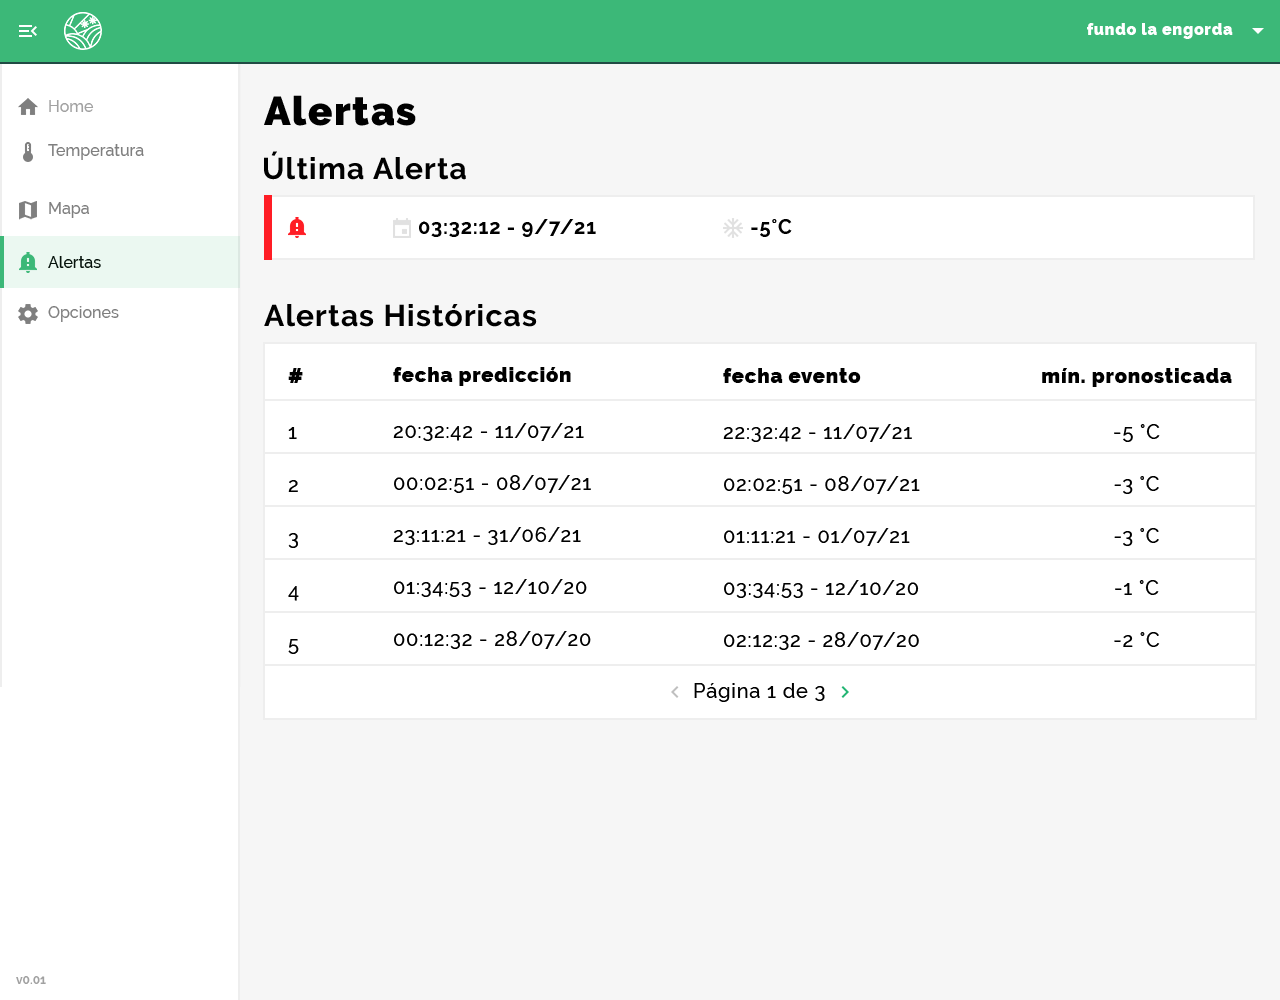
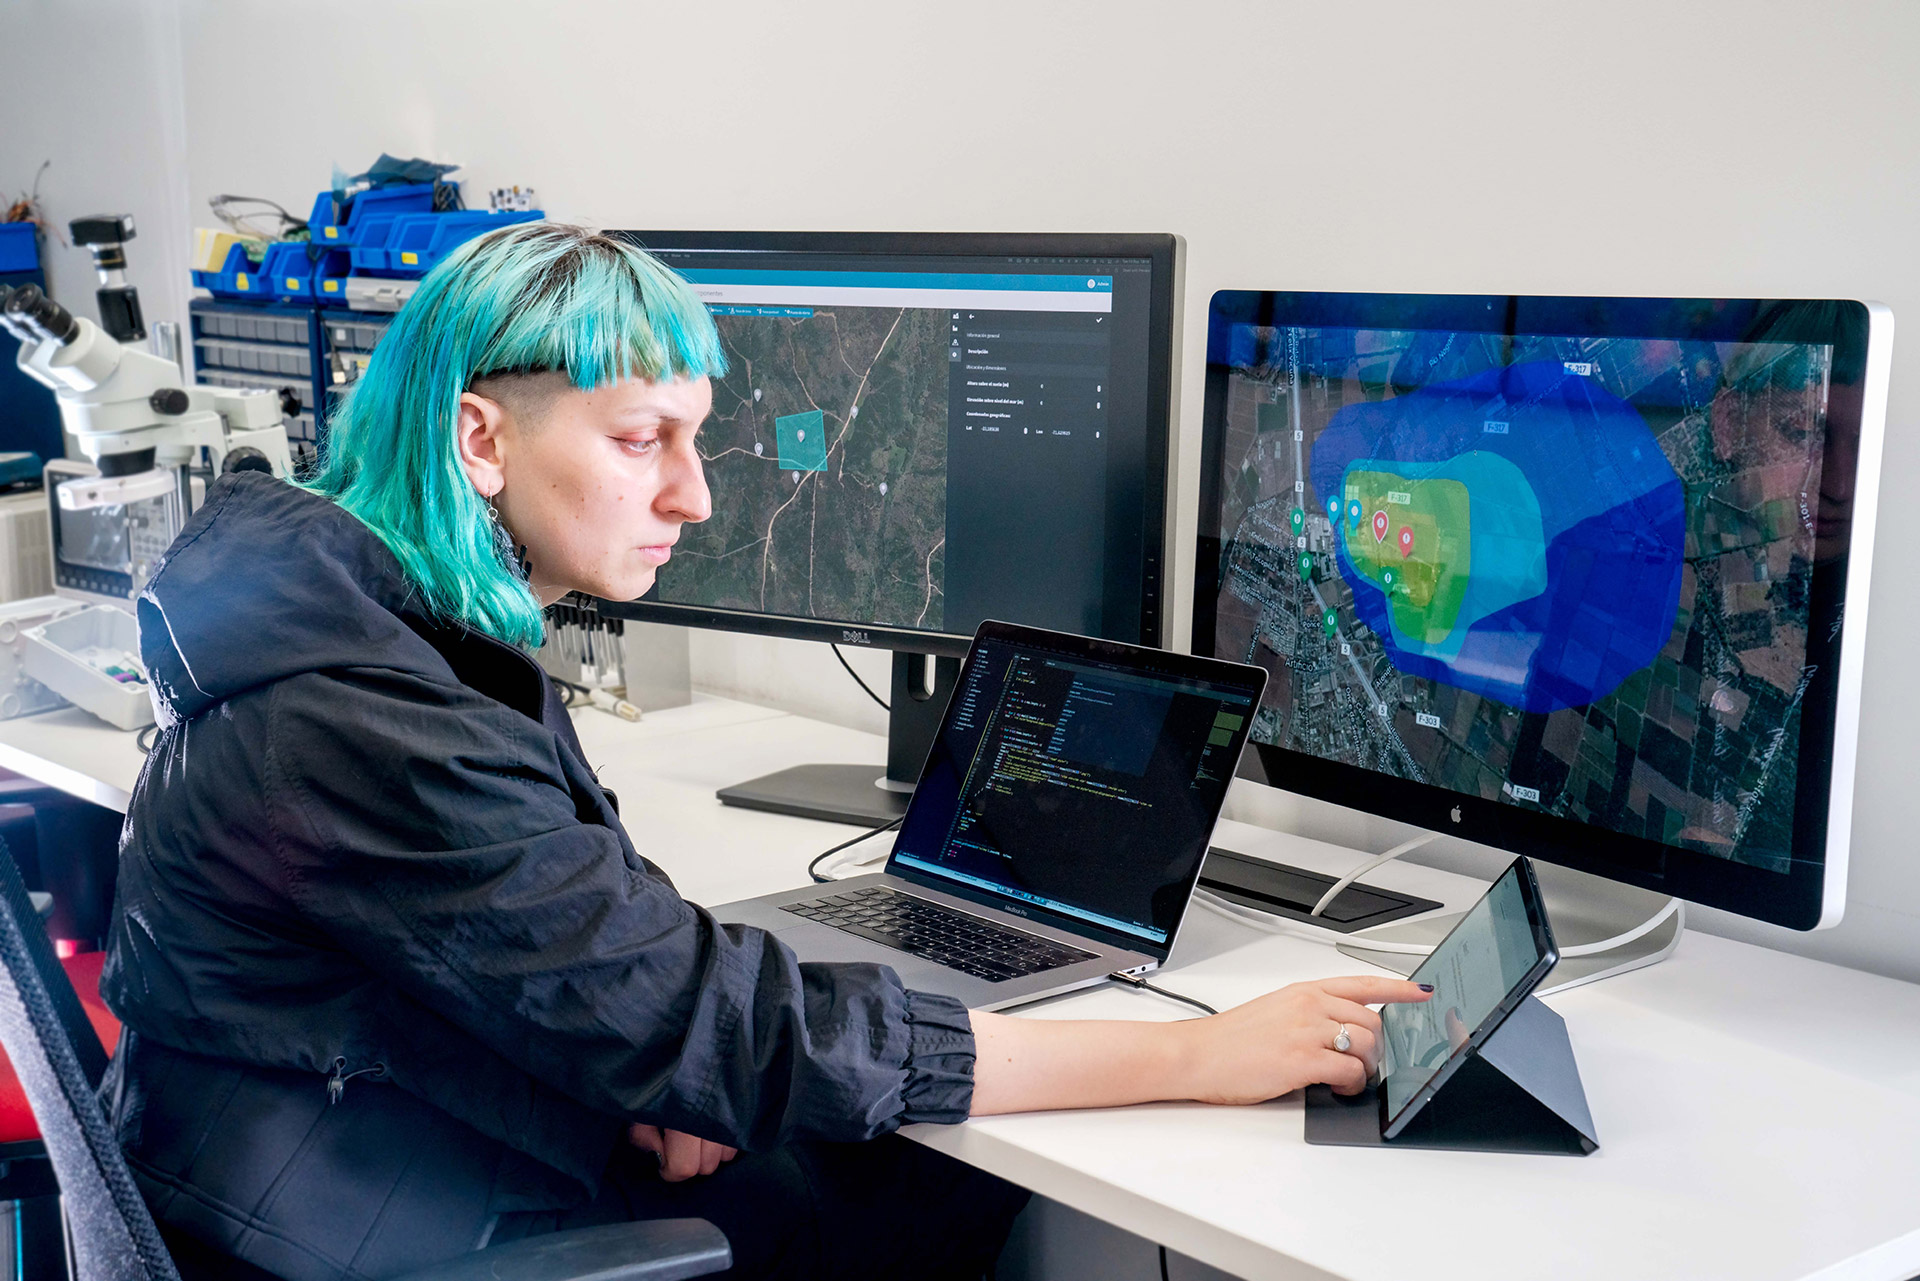
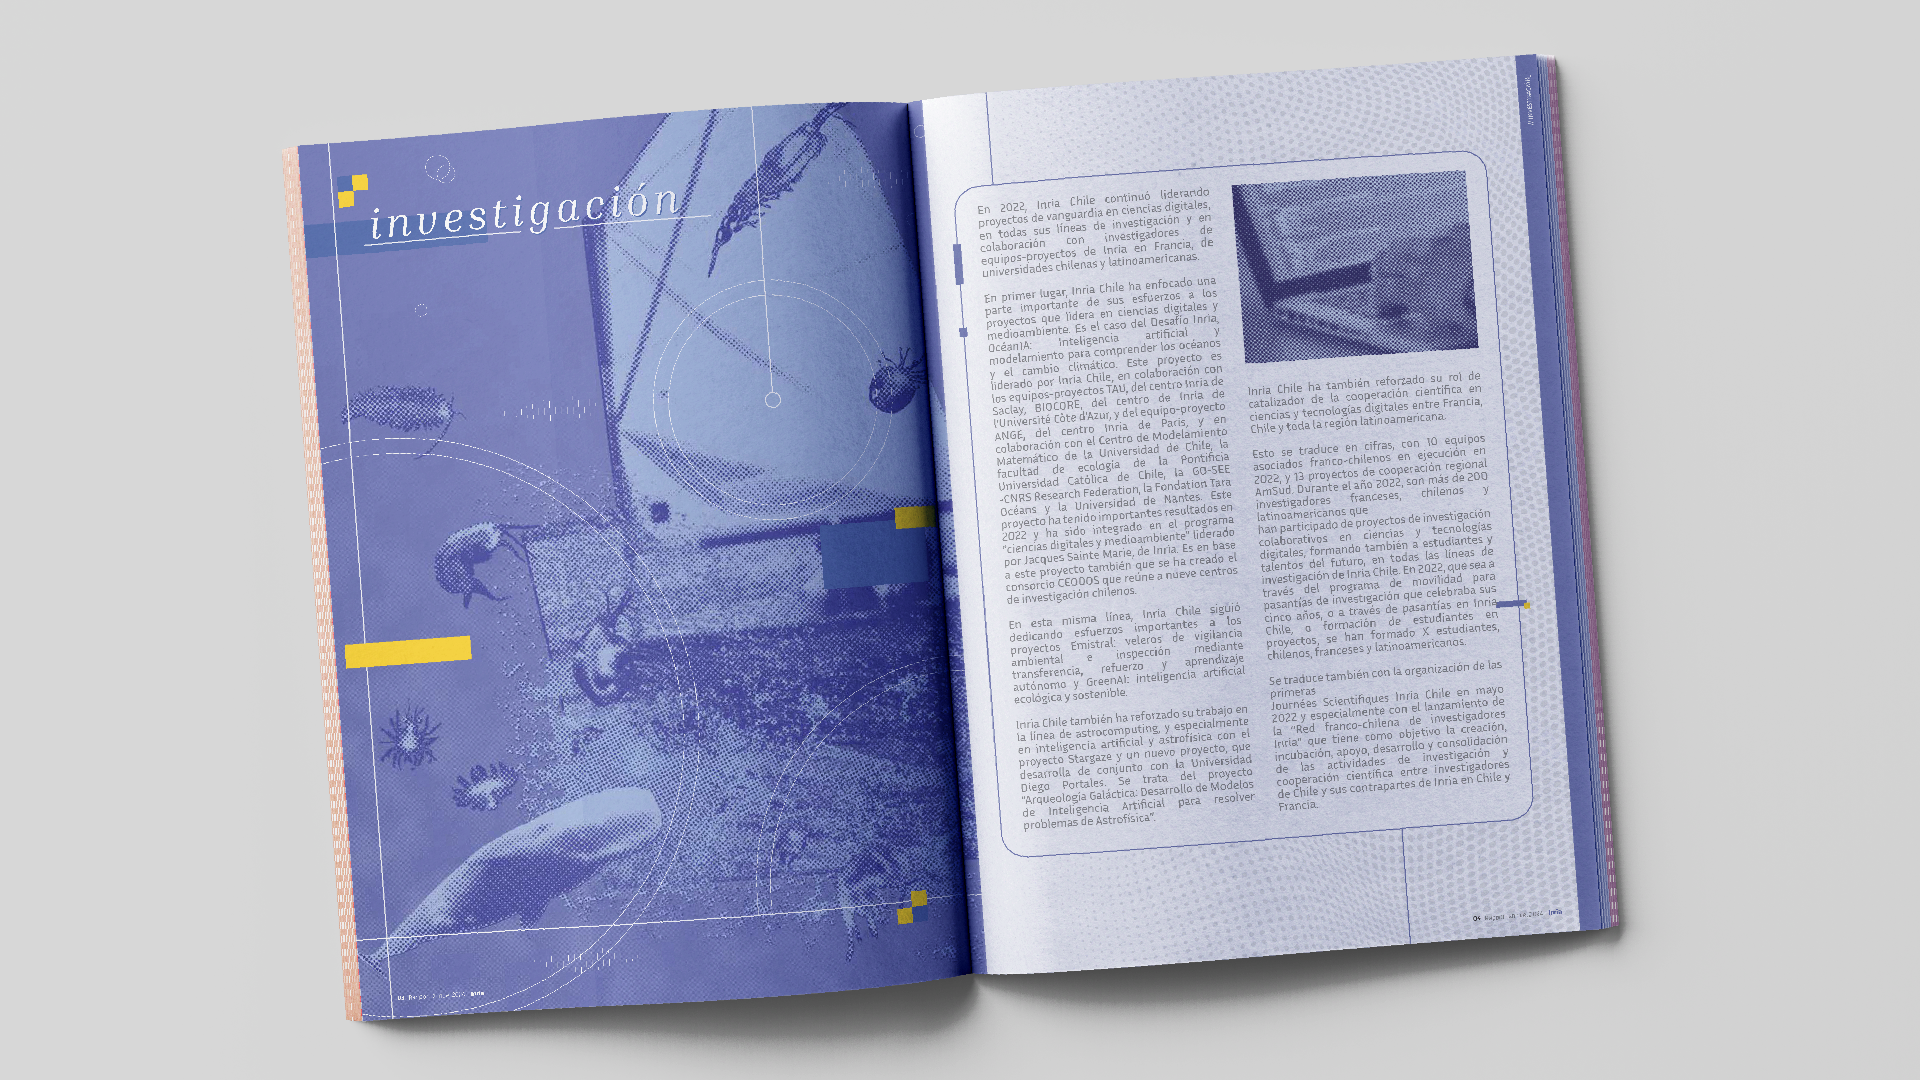
Observatory Operations GUI
Lead
Designer
Developer
HMTL
CSS3
Javascript
React
Redux
Github
Jenkins
JIRA
Confluence
ClickUp
Eslint
Black
Pytest
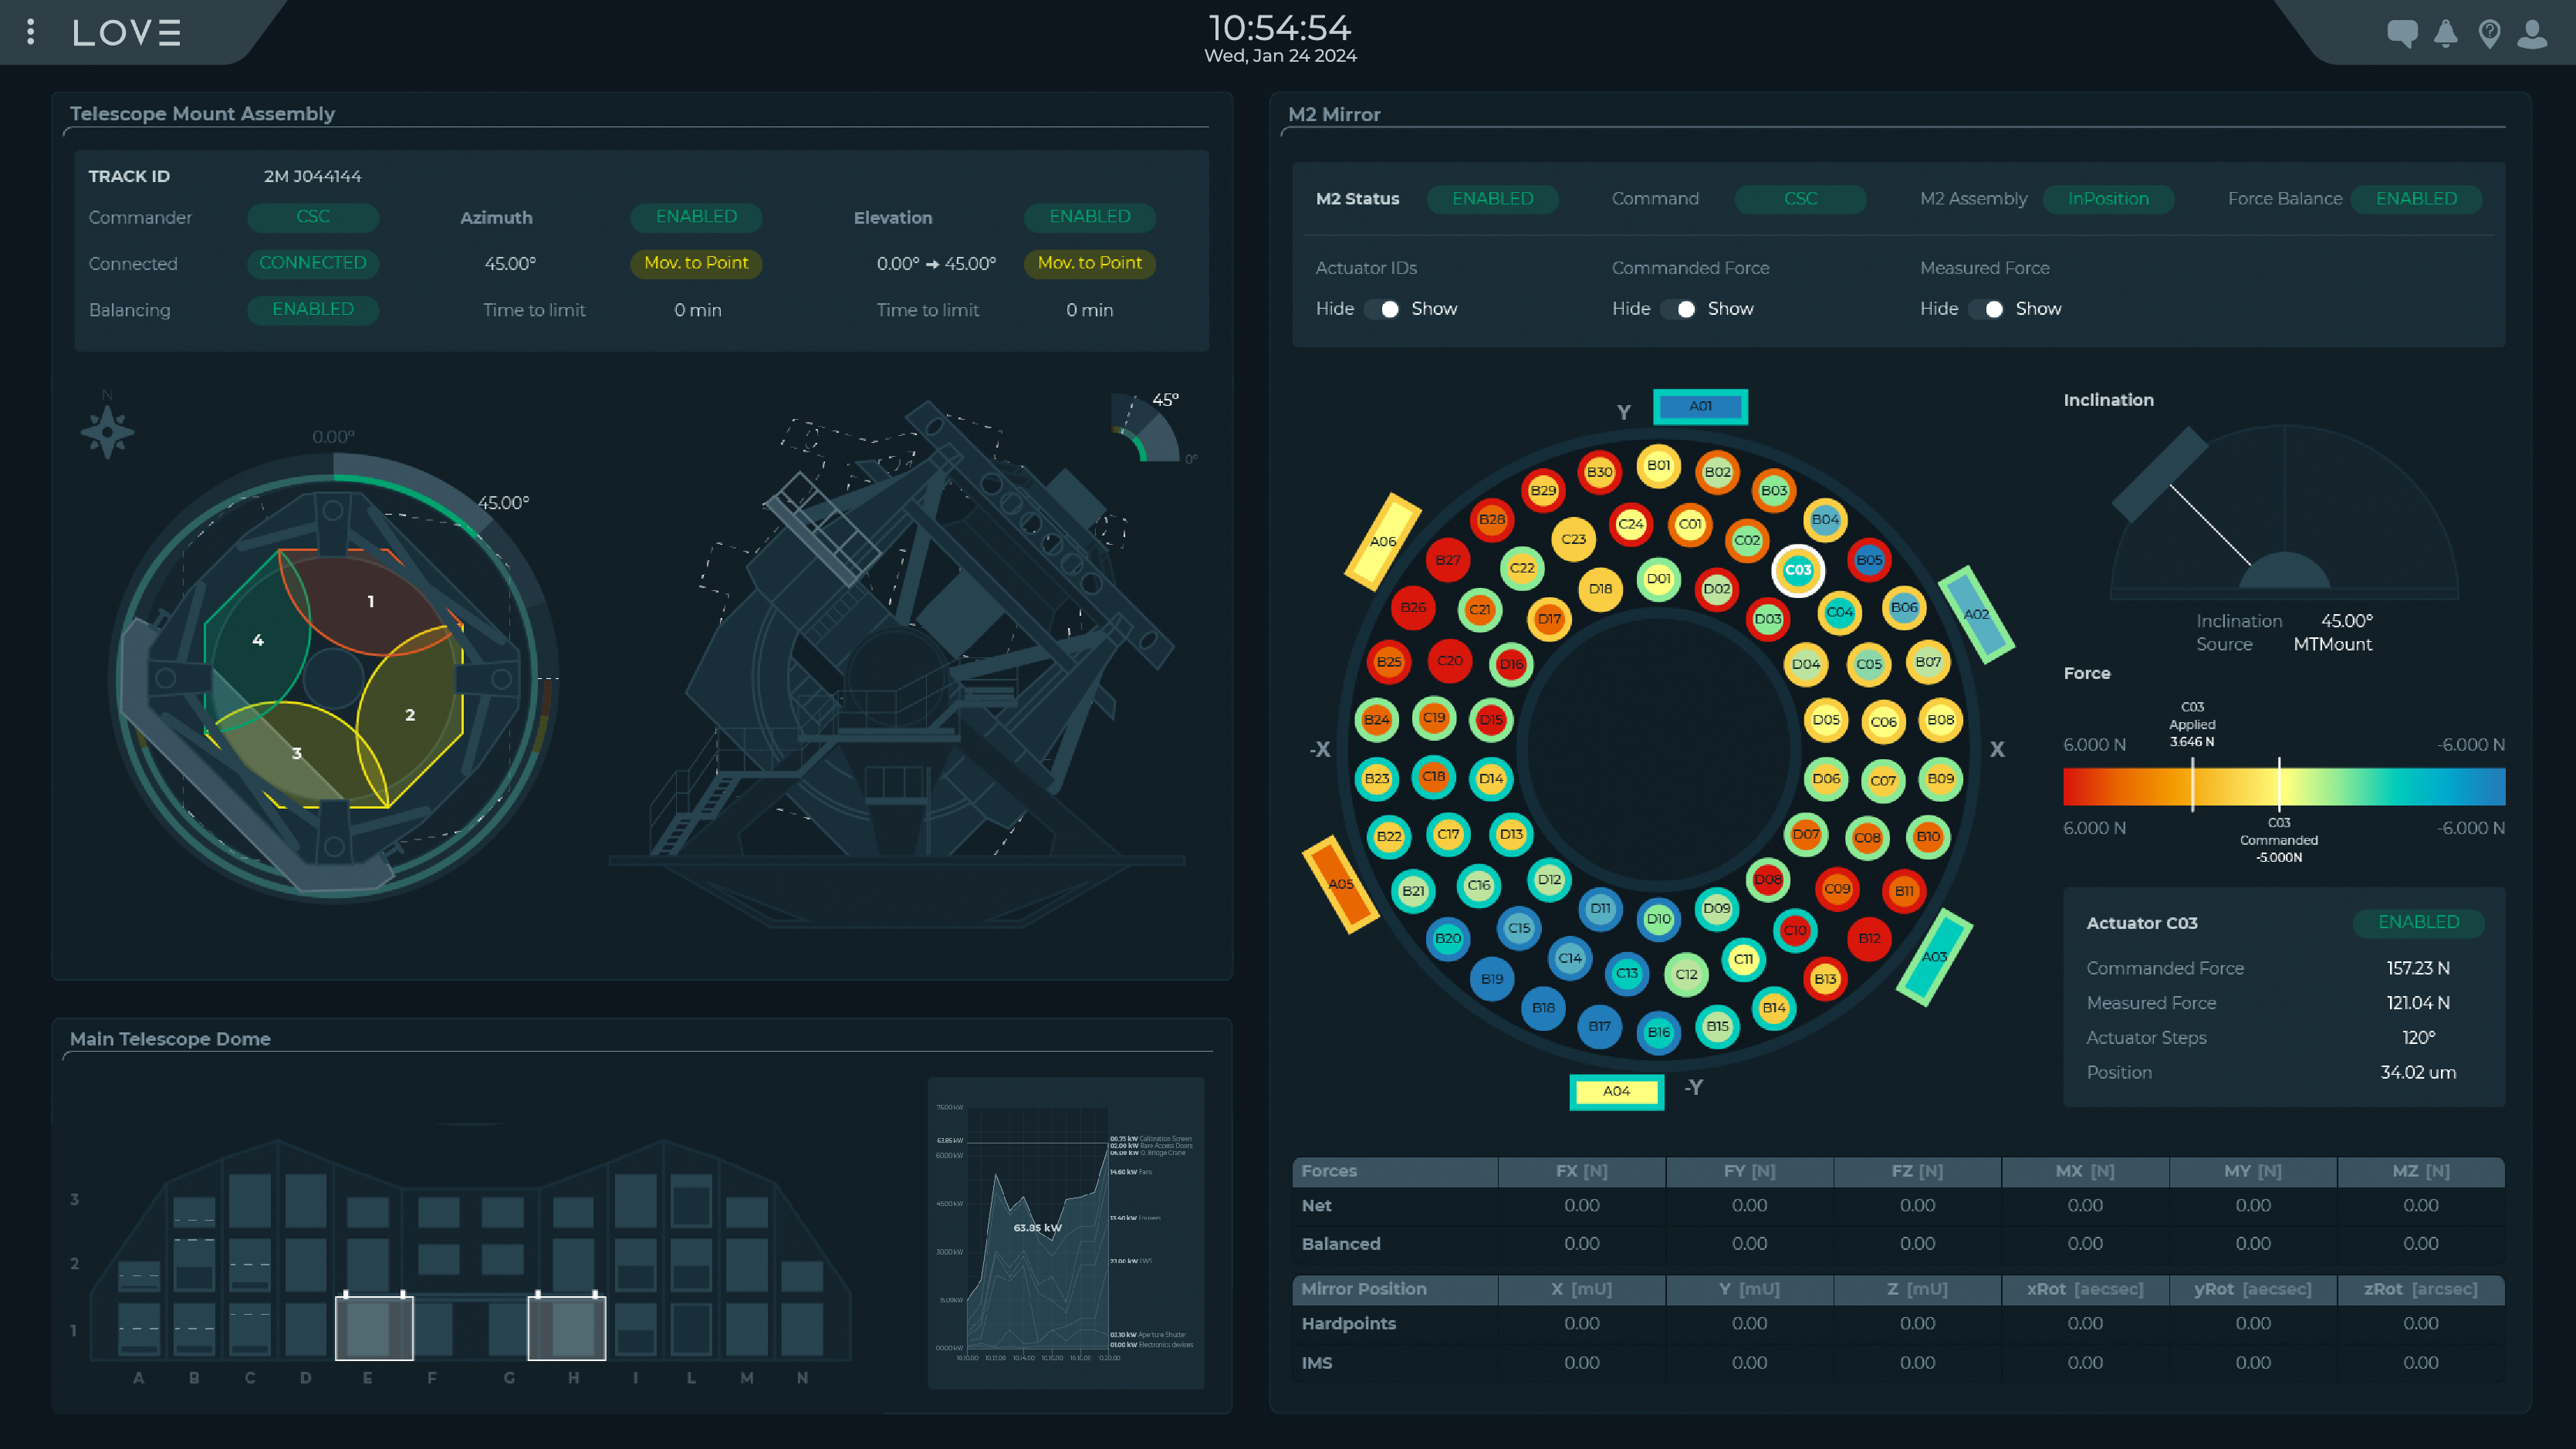
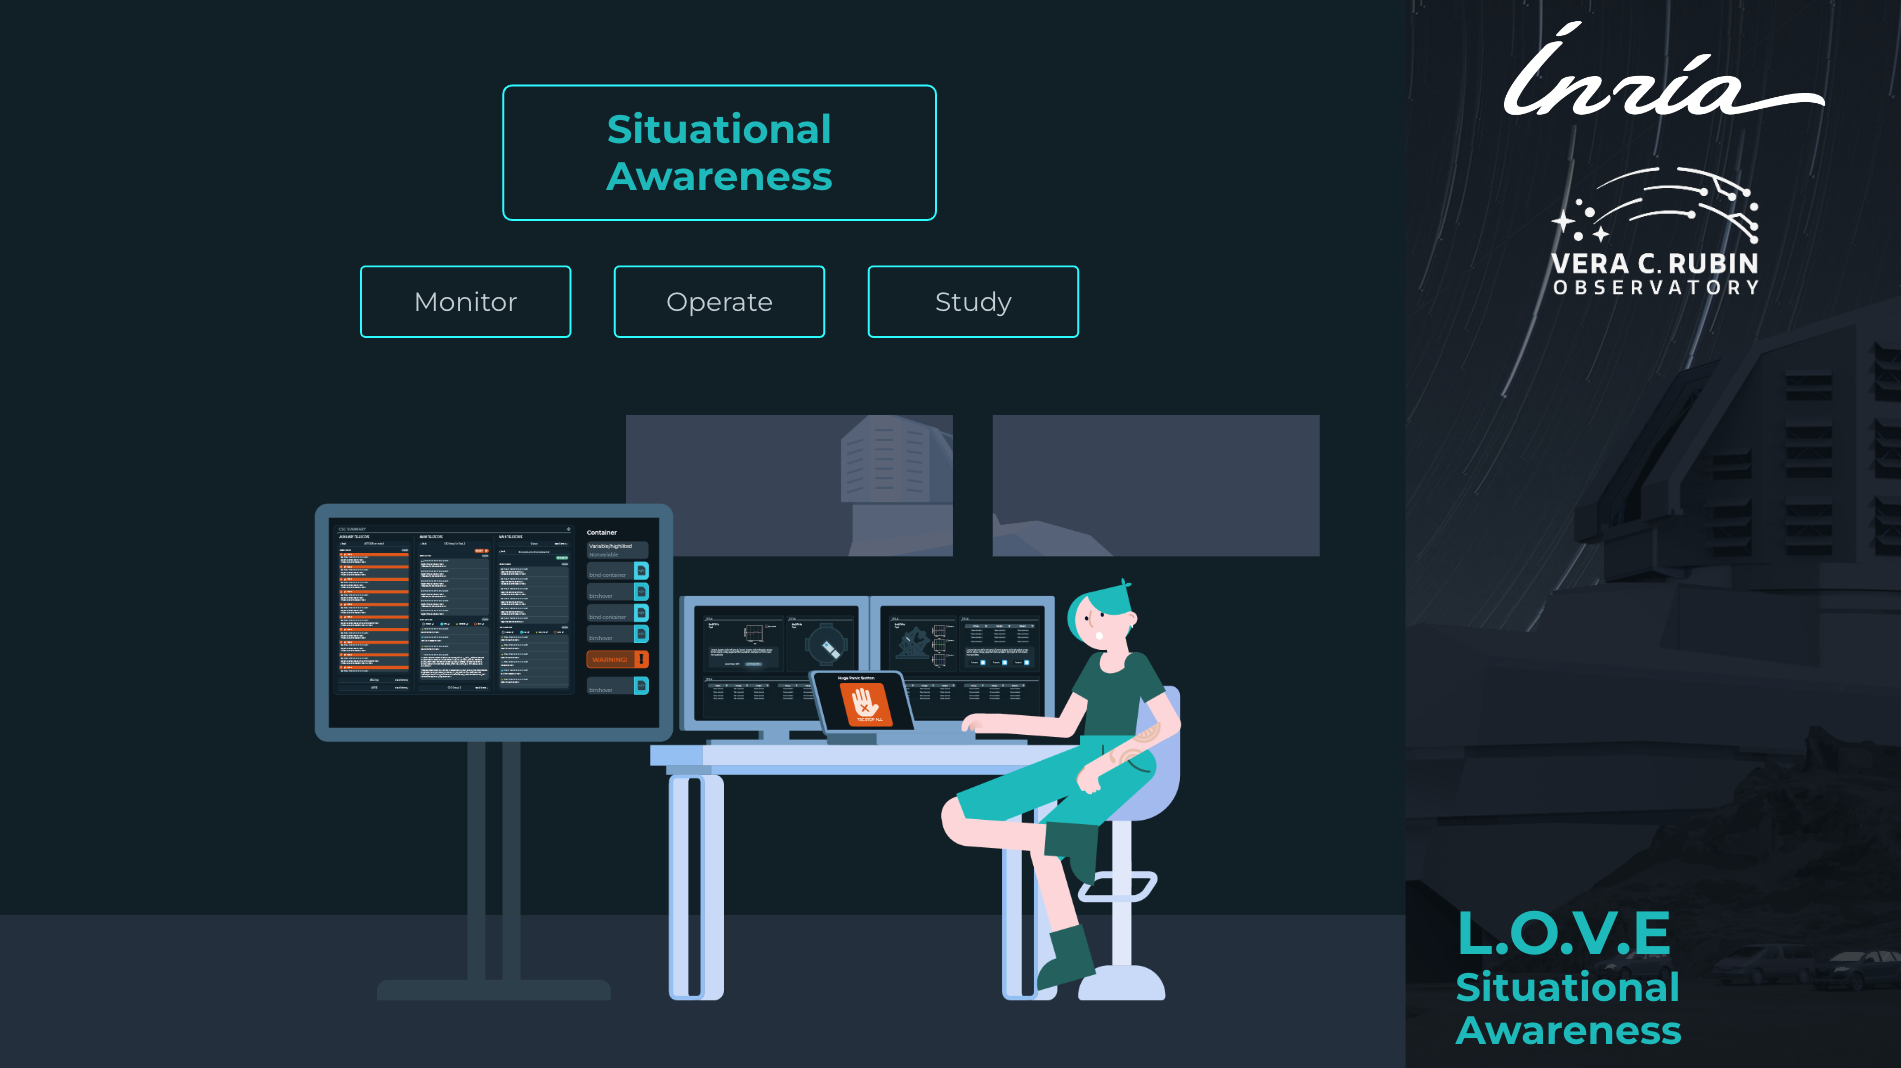
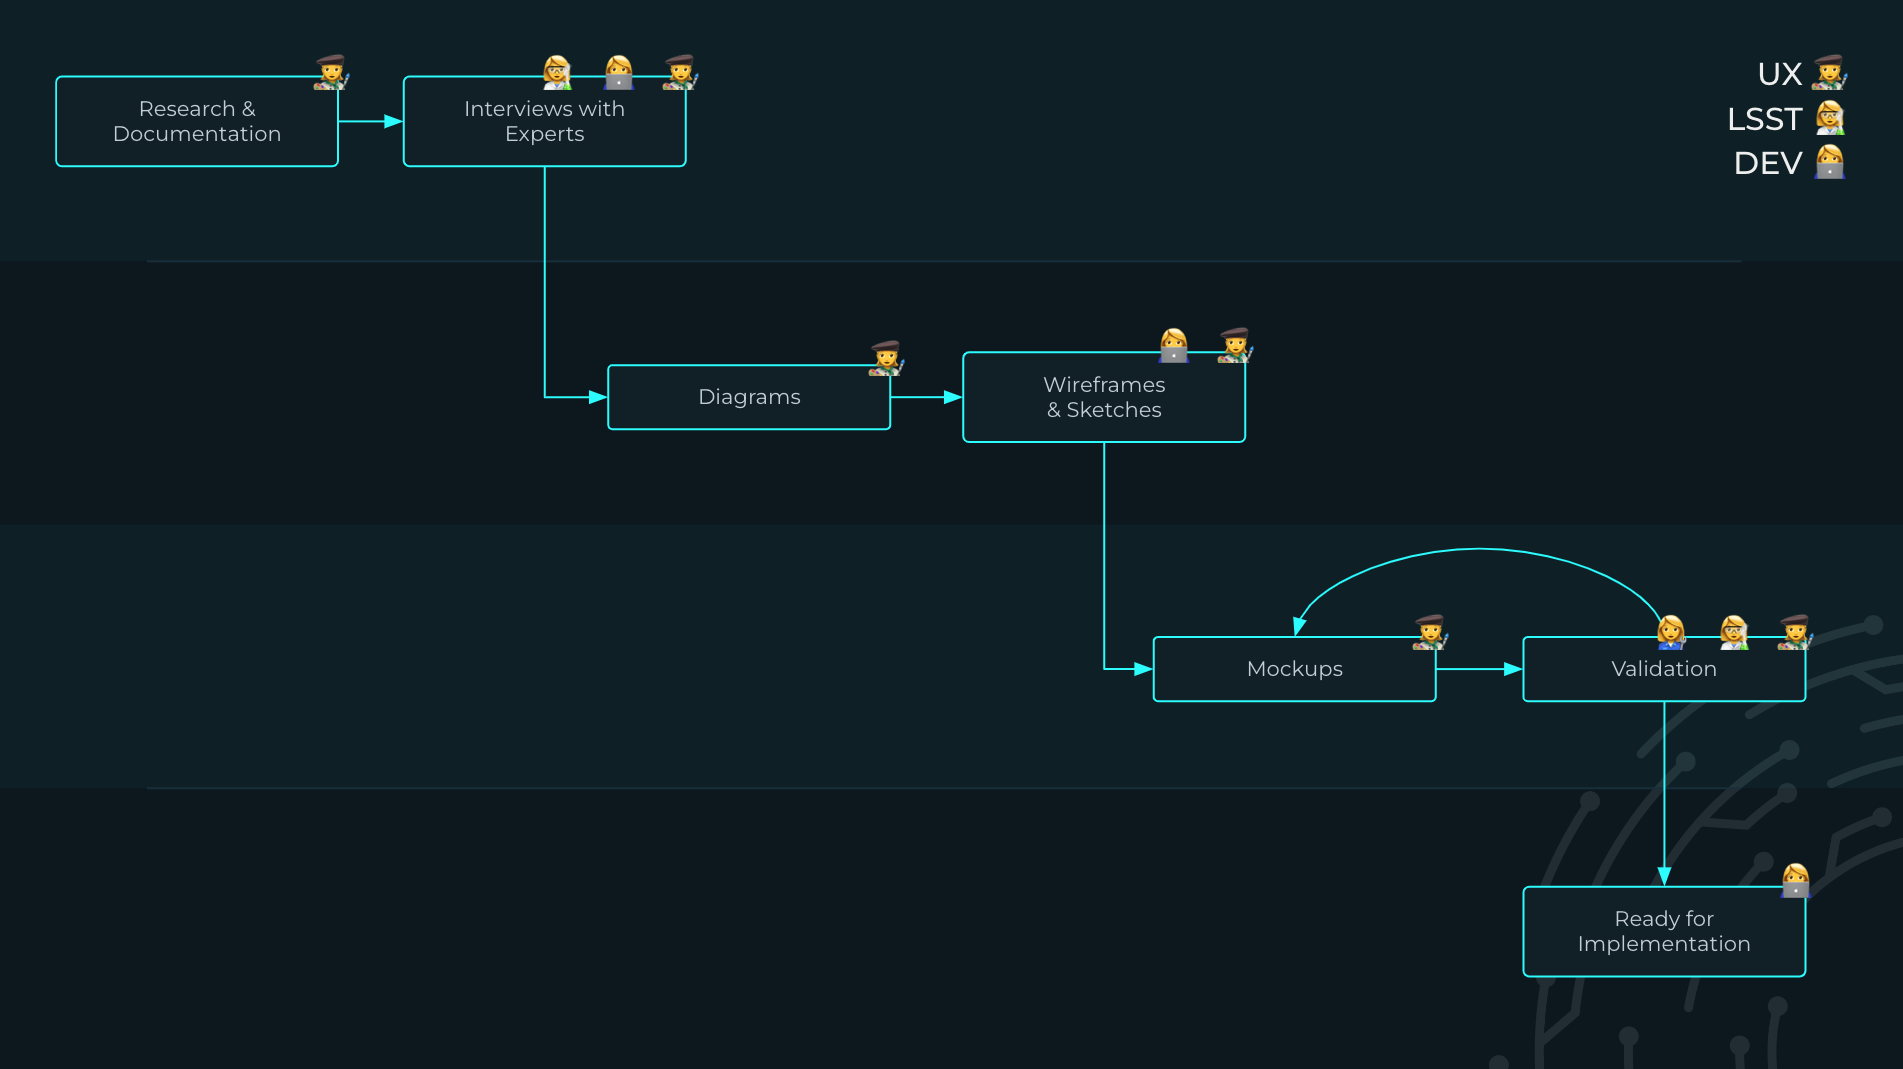
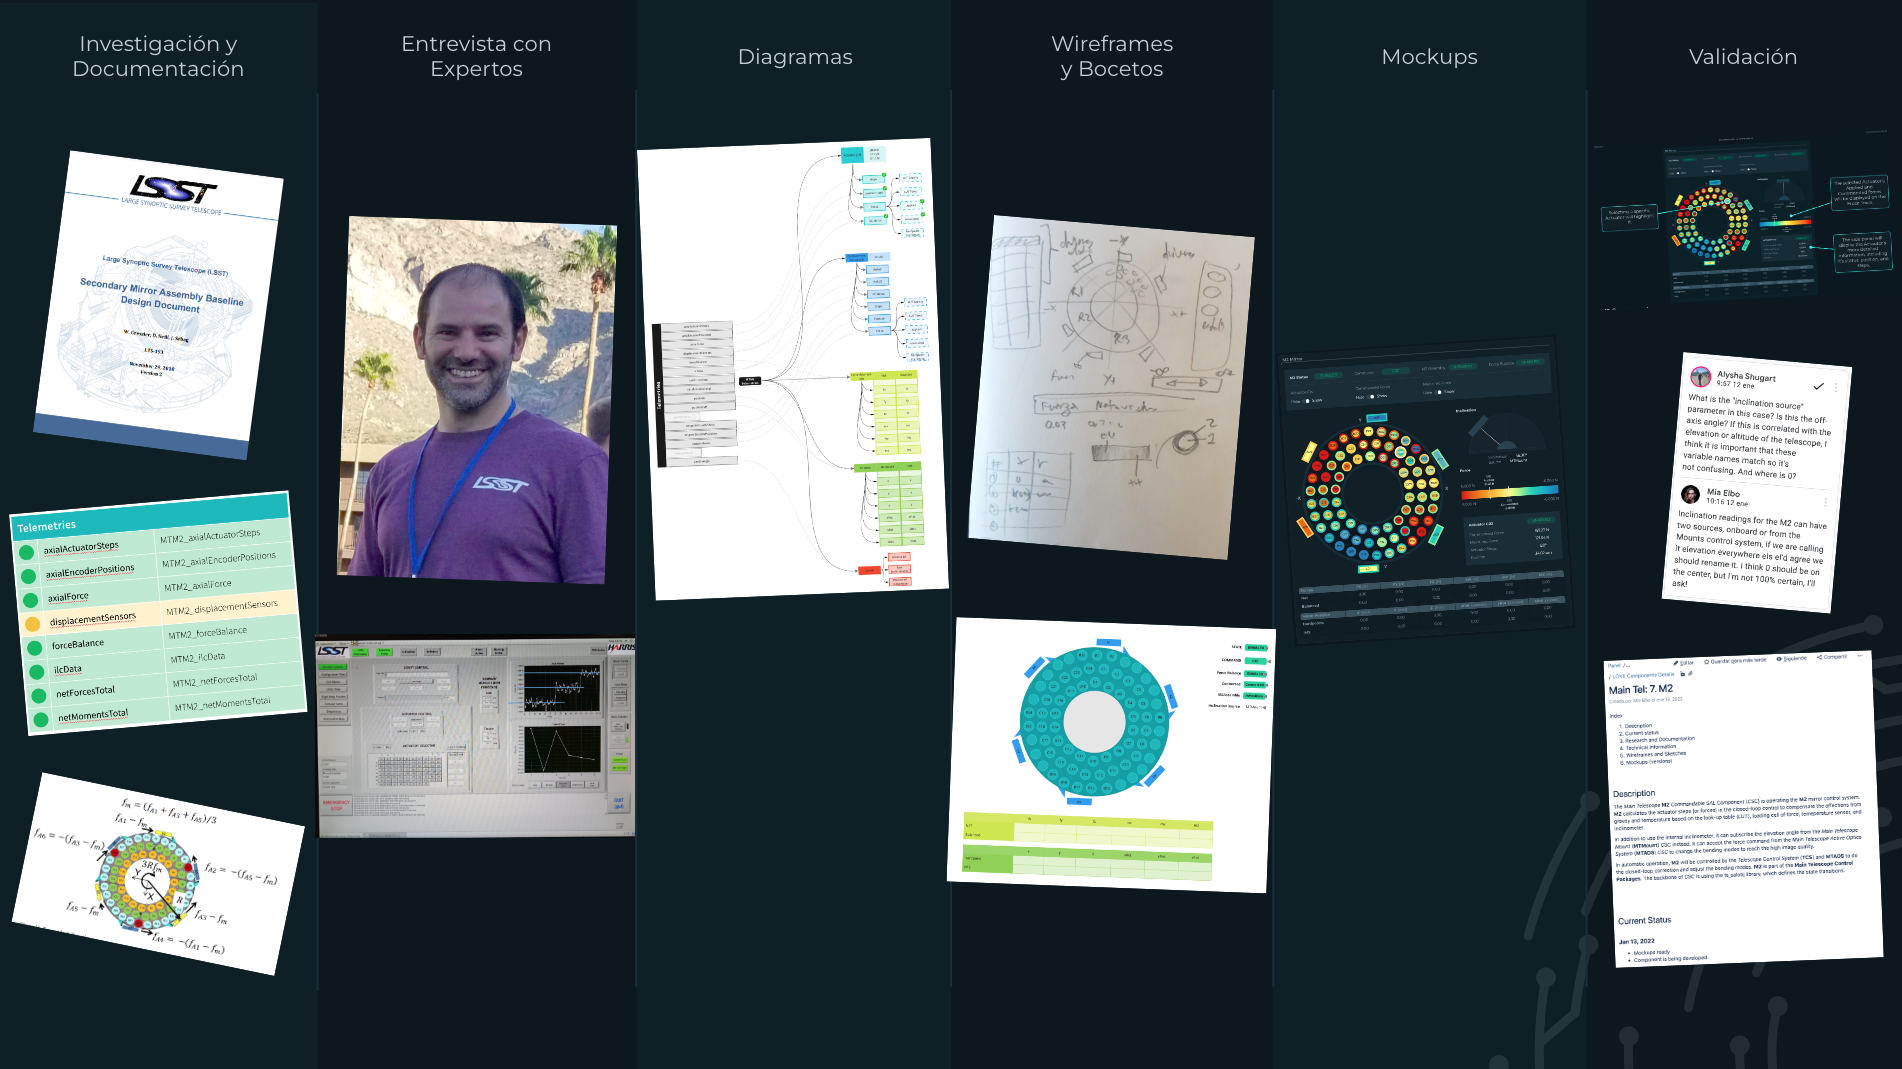
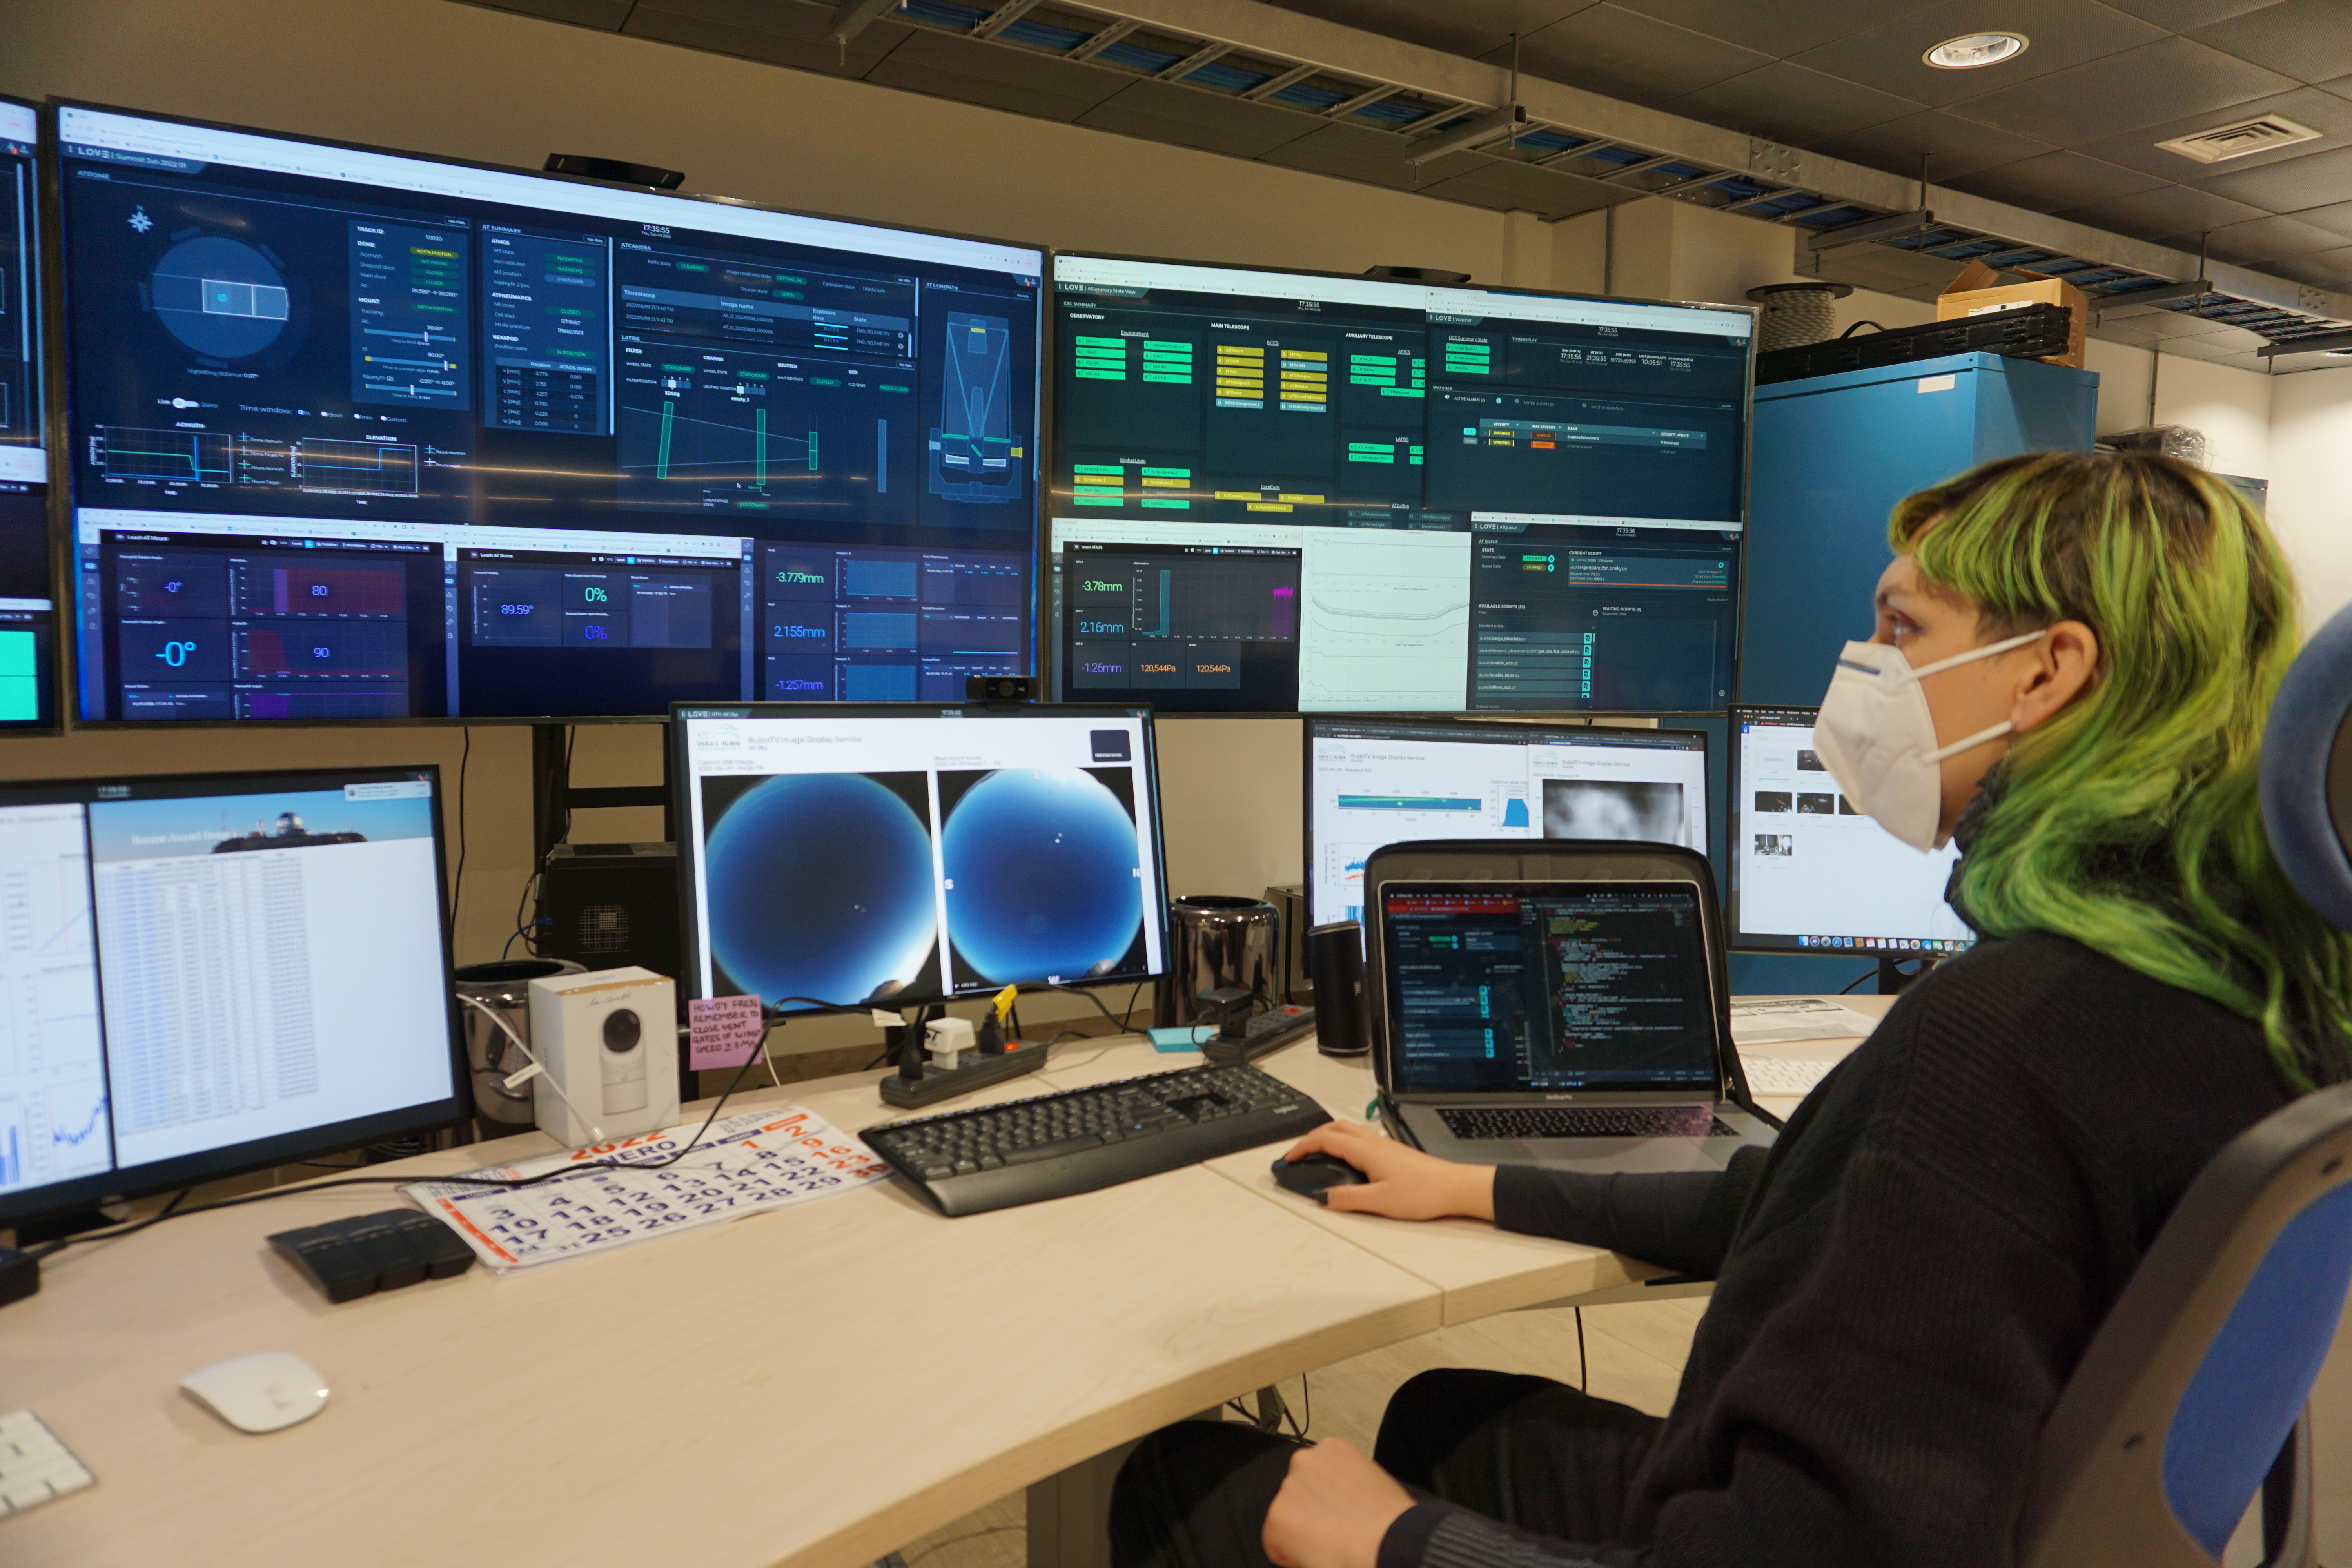
The LSST Operators Visualization Environment (LOVE) is one of the most fundamental pieces for the succesfull operation of the Vera C. Rubin observatory. This giant telescope has more than 65 systems and subsystems, that need to be monitored at all times by Science Experts and Operators, and the fact that that most of the stuff that had to be design was still under construction was a challenge to say the least. I'm increadibly proud and happy to have been part of such an endeavour of science and technology.